Using R and machine learning to make playoff predictions
NBA Playoff Predictions
The NBA playoffs can either be the highlight of a fan’s year...or their worst nightmare. After the regular season, the top teams face off to see who’s best. But instead of a single elimination game, each series requires a team to win four games to advance, which leads to wild upsets and comebacks. Even though the playoffs started a few weeks ago, I thought it would be fun to see if I could predict how the final 8 teams perform using machine learning.
Set-up and Data Collection
To approach this question, I figured machine learning would be the easiest (and most fun) way to go. I compiled regular season stats from the past 10 years for the final 8 teams in each year’s playoffs. Based on how far each team went, I gave them a score from 1 to 8, with 1 meaning they won it all. For the 2025 season, I collected the same stats for the final 8 teams but left the score blank, making this my target variable.
I used the tidymodels package in R to create a recipe for cleaning the data. Pretty quickly, I realized that any model I used would likely assign the same score to multiple teams rather than ranking them uniquely. To get around this, I treated the score as a continuous variable and used regression models. That way, I could generate a score for each team and rank them from highest to lowest. This also made it possible to simulate bracket matchups using those rankings.
Note: This was just a fun side project, so I didn’t go too deep with feature engineering or model tuning. But if you’re into that, doing more there would definitely improve the results.
Comparing models
I trained four different regression models, then averaged their predictions to get a final ranking. I used tidymodels, which makes everything super straightforward.
Boosted Forest
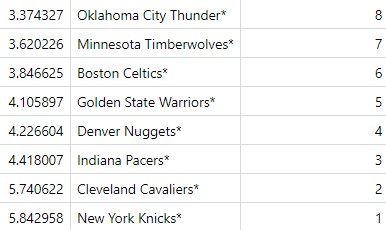
Here are the results for the boosted forest model (with 1 = most likely to win). According to ChatGPT, the Thunder are the current favorites so it’s interesting that this model had them doing the worst.
Linear Regression
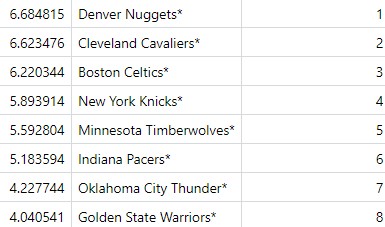
You can’t do a regression problem without trying a simple lm model, right? These results also have the Thunder not doing as well, but I could get behind the Nuggets winning. Since I’m a Jazz fan, I don’t really care who wins, but I just feel in my soul that the Nuggets could make it happen.
SVM
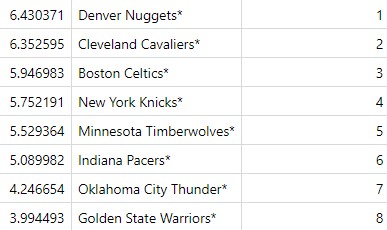
I’m not usually an SVM fan, but I figured why not? Surprisingly, it gave the exact same order as the linear regression model. So either I did something very right… or very wrong.
Neural Network
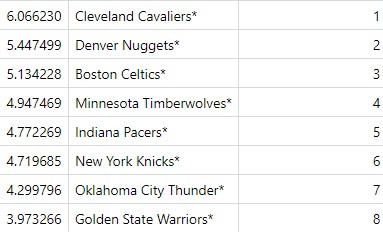
I know “neural network” sounds intense, but with bag_mlp() in tidymodels, I threw together a super simple single-layer model. For more complex problems, I’d use something deeper, but for this it was a fun experiment. These results varied a bit, but overall the same teams floated to the top across all models.
Final Predictions
So I know I could’ve stacked these models or tuned them more to get a super powerful final prediction, but I wanted the results fast before any more games were played so I just used dpylr to combine the predictions into one table, then get the average prediction.
Here are the final results:
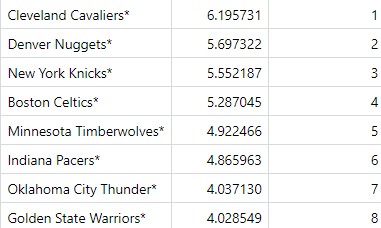
Once I had these rankings I could use them to complete my bracket to look like this:
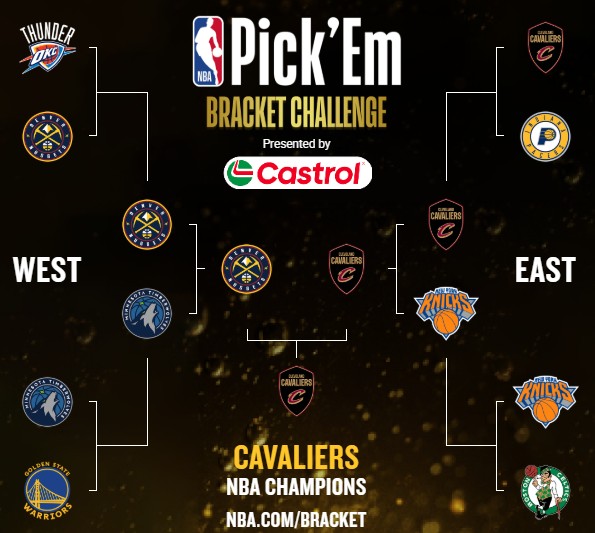
I’ll be honest, I’m not sure how much faith I have in these results but it’s always fun to mess around with data. It will be fun to see if I get any of my predictions right from this simple machine learning project. I’ve never considered myself a Cavaliers fan, but I have to cheer for them now! Overall if I did this again I would collect more data and do more feature engineering, and tune my models. I think there is definetly potential with this set up and the models I selected if I went deeper into this project.
As always thanks for reading :) I’ll post the results once the playoffs are over!