How to use R to run a simple analysis to improve your fantasy football picks.
Fantasy Football. Real Strategy.
Fantasy Football is in full swing and after a hard loss to my 10-year-old cousin, I realized I needed to step up my game. Luckily, I realized I have a big advantage: I’m a statistics major! I spent the last week researching the best metrics and data sources and now I’m sharing with you how I improved my Fantasy Football team and how you can too!
How Fantasy Football Works
To start let’s make sure we’re all on the same page for how Fantasy Football works. I play in an ESPN league, although there are several other websites you can play on. Essentially, you can have up to 17 NFL players on your roster with 9 players as your starters. Each week you are matched up with another fantasy team and as your starters play in their real-life games, they earn points for your fantasy team. At the end of the week, whichever fantasy team has the most points wins that match-up.
The points are made up of many different components based on a player’s position. Here is how ESPN calculates the main points:
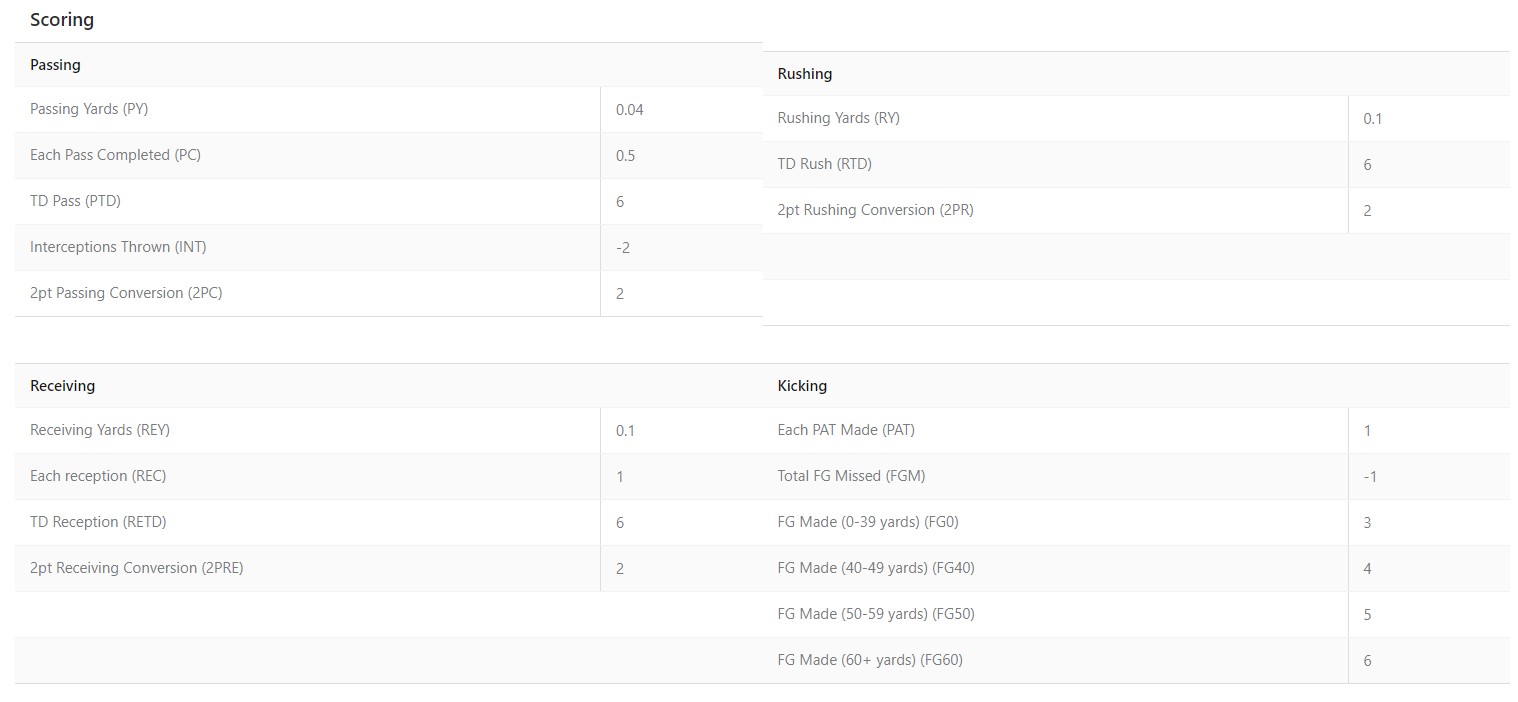
With so many factors adding up to how points are earned, it’s nearly impossible to separate the signal from the noise when predicting fantasy football along with any other sports analytics. That being said, I had to take a look for myself as the app-provided stats were leading me astray. I have broken this process down into 3 steps of how you can start your own fantasy football analysis.
Step 1: Gather Your Data
You can download my code to follow along at the bottom of the page under resources
There are many different sources on the internet to collect data, many people even have dedicated websites to collecting football stats. After researching, I decided to go with a fantasy football R package called “ffopportunity”. This package scrapes the most updated data from NFL play-by-play data and builds a data frame of Expected Fantasy Points by applying an xg-boost model.
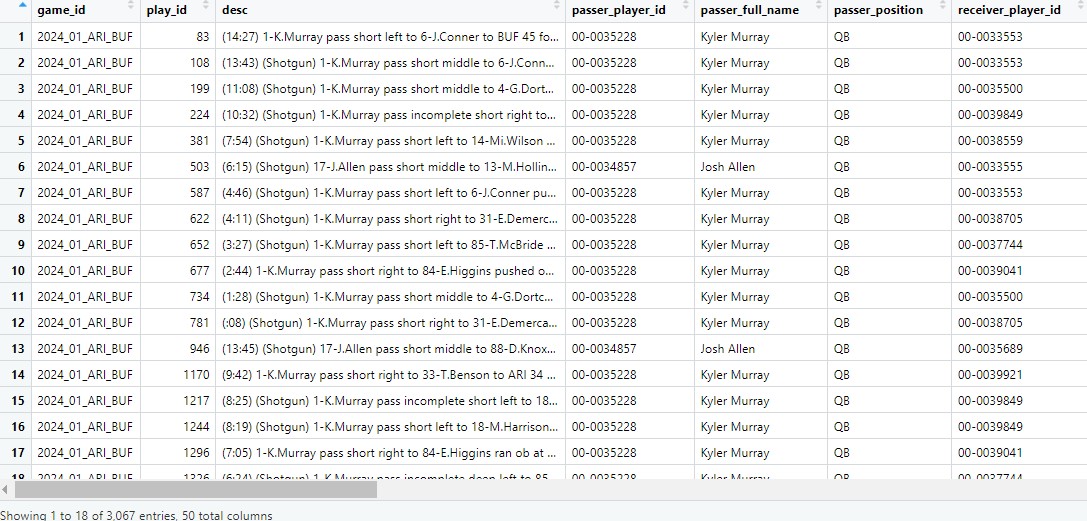
Once I installed the “ffoportunity” package, it was easy to upload the data. The data splits into 3 tibbles, one for an overall player summary, one focused on passing yards, and the last on rushing yards. I took each one and changed it to a data frame. Here’s what the passing yards data frame looks like.
Step 2: Choose Your Metrics
The next step is the fun part where you get to make this analysis your own. As I mentioned before, if it was easy to predict fantasy points, there would be no point in playing. As such there are already hundreds of models and ideas trying to get the best predictions. After lots and lots of research, I decided to start my analysis with air yards to keep it simple.
AIR YARDS: From the multiple websites and models I looked at, air yards are always very correlated with fantasy points. Air yards measure how far the football travels in the air past the line of scrimmage - both incomplete and complete passes are included. This mostly applies to quarterbacks, but wide receivers also get a few points to their name. To look at this metric I used ggplots to created a scatterplot.
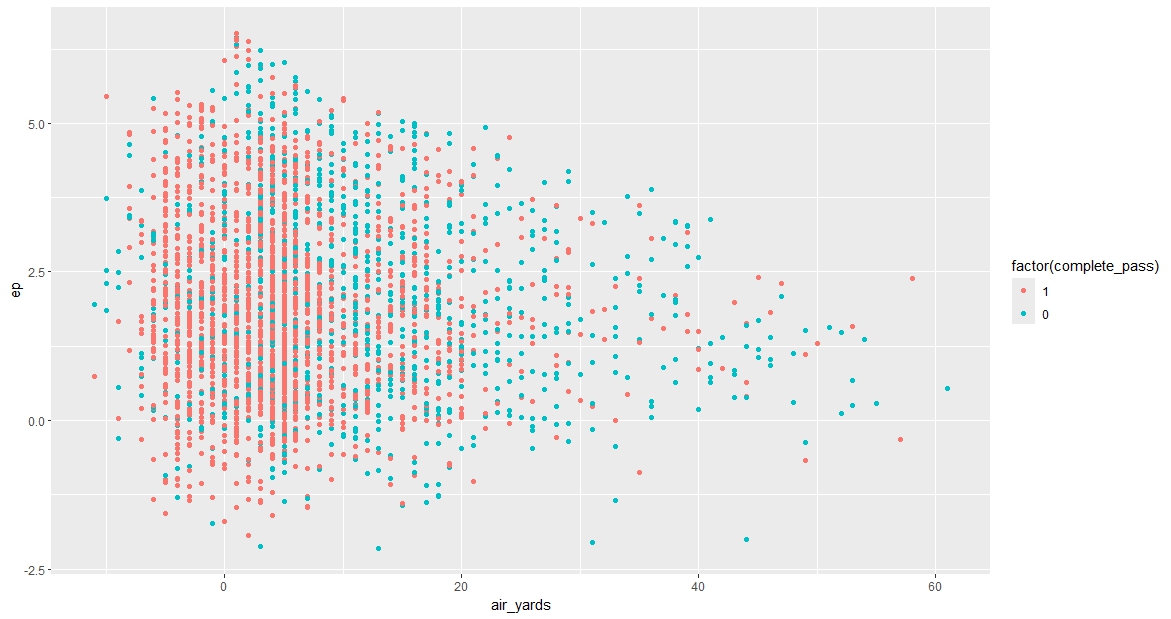
This graph is really messy. Each point is an individual pass attempt and there is so much data it’s hard to make anything out. I colored it by if the pass was incomplete or not in hopes that it would show a clearer trend, but as you can see it is still very messy.
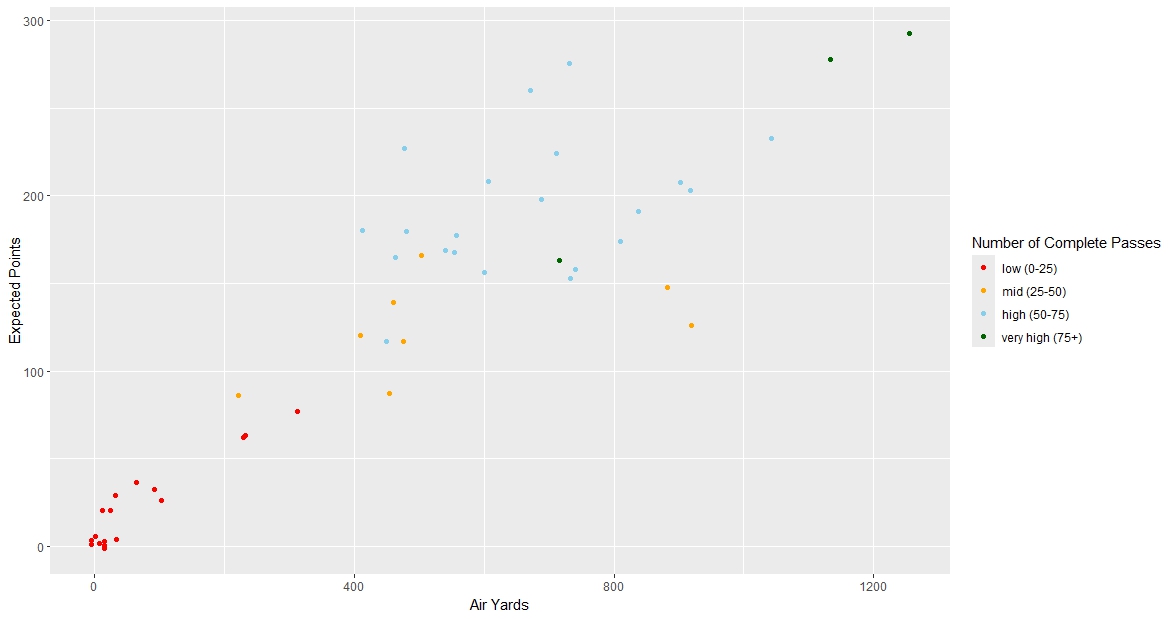
I knew I needed to do some data engineering to get more from this data. I decided to start by grouping by quarterback so instead of 3,000+ data points, I was left with 49. This also meant I needed to sum together the air yards, completed passes, and expected fantasy points. Because I still wanted to see the points earned from incomplete passes, I changed completed passes to be a numeric value instead of a factor; this way I could still add up the passes without filtering out information from rows with incomplete passes. Once I did this and added a few things for aesthetics, it was easy to see that there is a very positive trend between air yards and points.
There is also a very strong trend between complete passes and points. As straightforward as this seems, you need to choose players that have more playing time. Even if they aren’t viewed as star players, they will have more opportunities. In fantasy football terms this is simply put as “volume is king”.
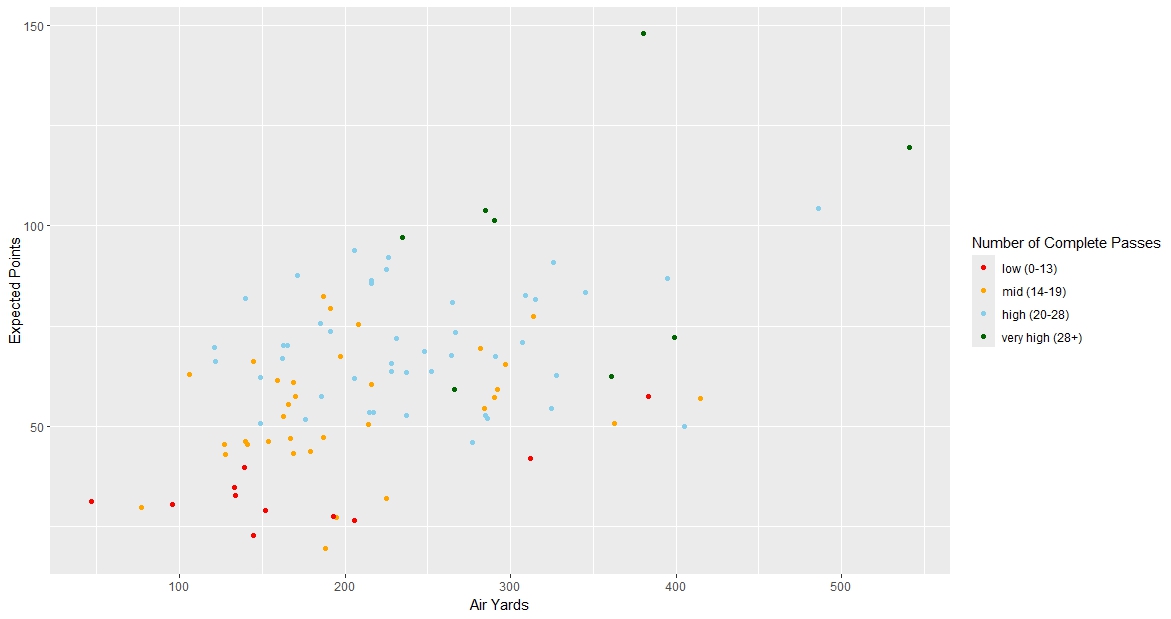
I next grouped my data by game to see if the trend was still relevant in an individual game. If you want to win a weekly match-up, you need your players to do good in each game, not just in their overall season. As you can see below the trend is still there in both air yards and completed passes per game.
Last, although the graphs are great visuals I wanted to be sure there is a correlation between air yards, complete passes, and expected points. I ran Kendall’s Tau Correlation Test to get actual values.
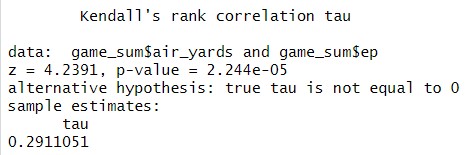
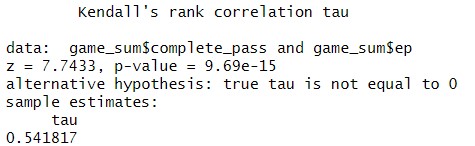
Although both air yards and complete passes have a statistically significant correlation with expected points, complete passes have a much stronger correlation than air yards. This surprised me a little as all my prior reading told me air yards are what you want to look at. But the results make since as complete passes are a direct way to get fantasy points. I also found the correlation between the interaction between air yards with complete passes and expected points, and it was also very high.
Step 3: Apply the Analysis to Your Roster
After my quick analysis, I had more of an idea of how these metrics apply to fantasy points, and it was time to update my roster. Unfortunately since many players were already spoken for, it wasn’t as simple as finding the players with the best metrics. But I used what I learned to move players around on my roster and I have a few players that I’ll be watching for future trades. My team ended up winning and my quarterback did better than ESPN predicted!
Conclusion
Overall I realized making fantasy teams is not as easy as I thought it would be. There are so many factors for each individual position and it takes a lot of commitment to continually update the data and account for your knowledge (like the oppenent or the roster you are facing in the match-up). My biggest takeaway was that they aren’t kidding when they say volume is important. You can run all the predictive models you want, but it won’t matter if your player only plays for a few minutes of the game. You also can’t predict when a player gets injured or has one of the worst games of their career. As the season continues I plan to look at more and more factors and try new models; this was just a start. If you have any ideas of metrics to look into next, I’d love to hear it. I’d also love to see how your own fantasy team is doing! Please reach out over email or through LinkedIn.
Helpful Resources
My R Code - use my R code to get started!
ffopportunity - the R package I used in this post
ffanalytics - another R package for downloading data
Air Yards - a cool website that looks at Air Yard Metrics
Advanced Stats - a youtube video of some unique stats to look at for fantasy football
Player Stats - a great website for looking at the most updated stats by player